Ensure:
TidyVerse is installed.
Dslabs is installed.
R - Script:
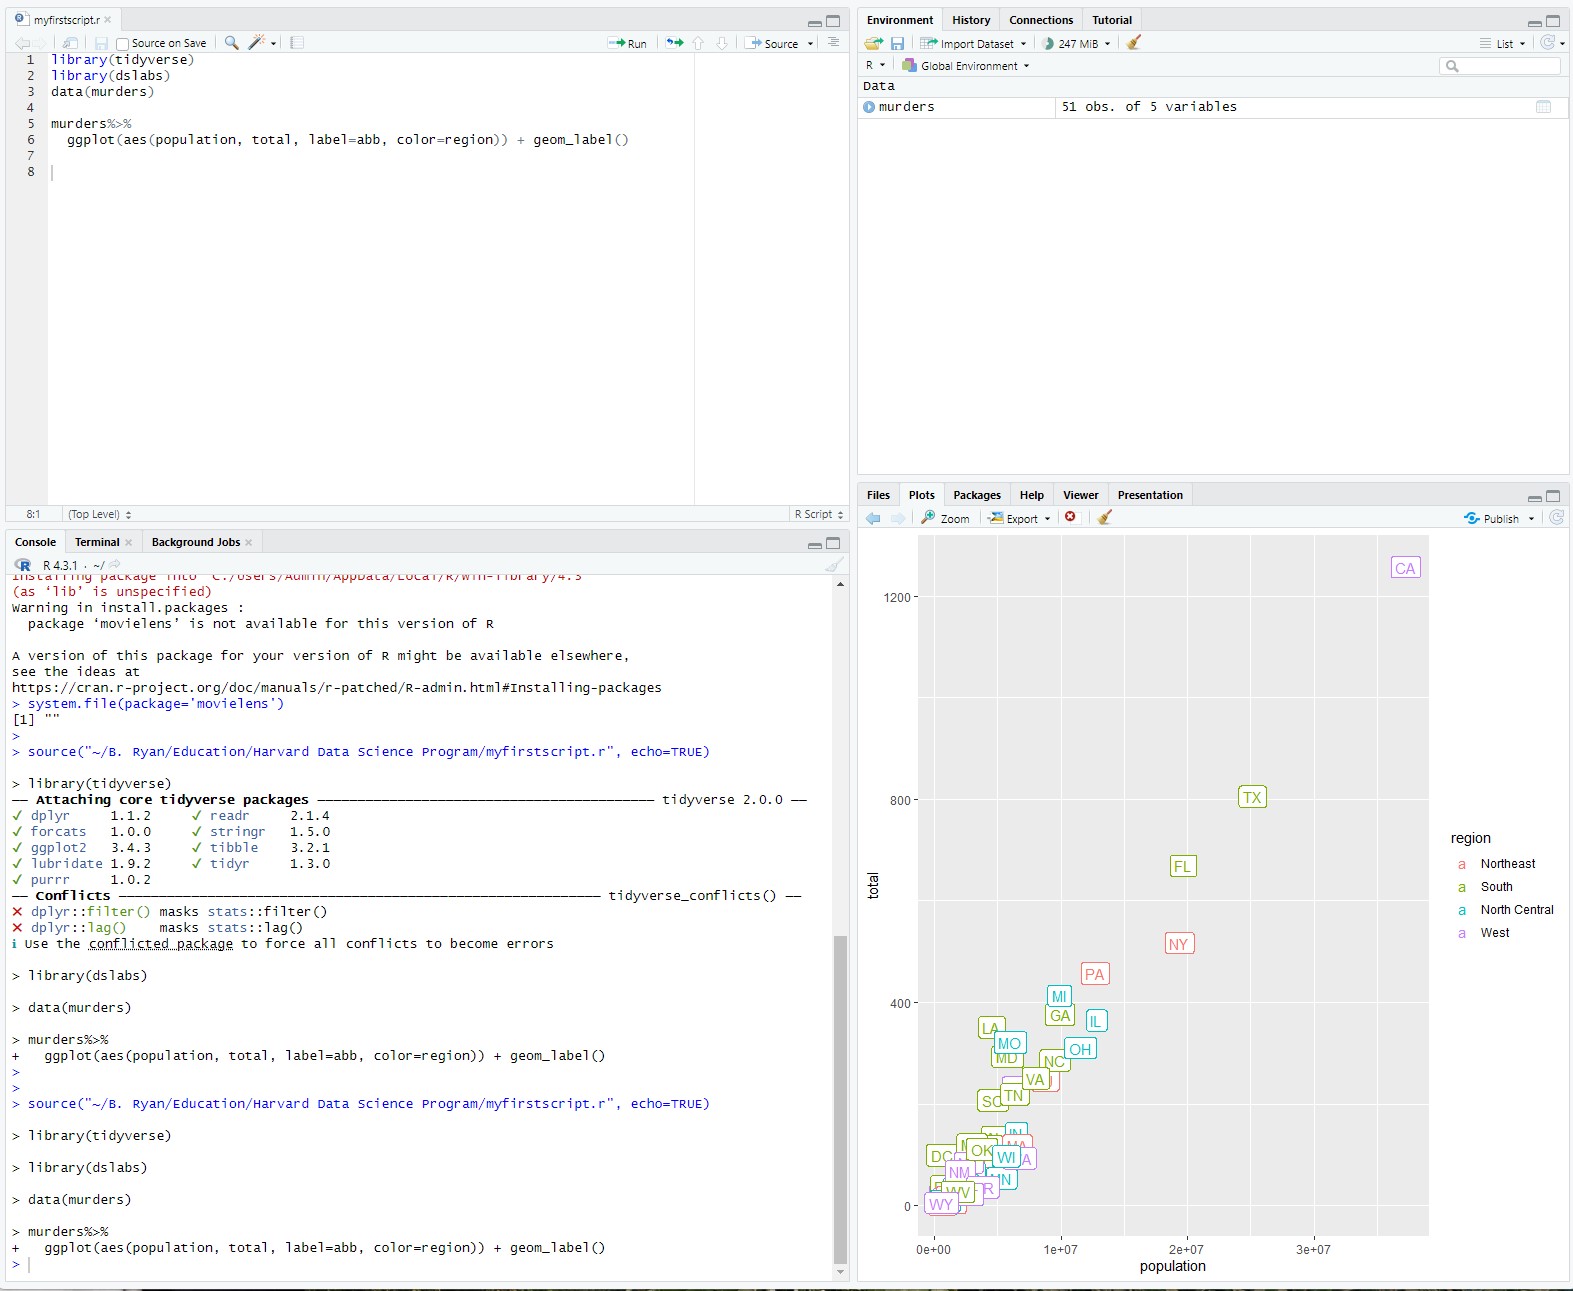
library(tidyverse)
library(dslabs)
data(murders)
murders%>%
ggplot(aes(population, total, label=abb, color=region)) + geom_label()
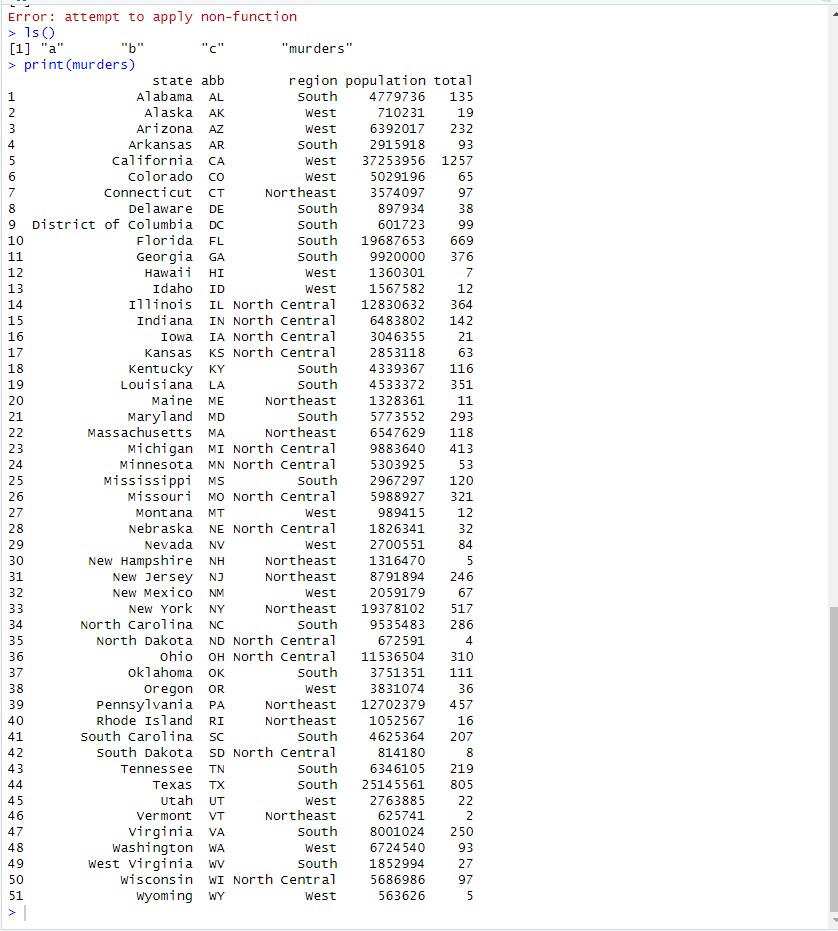
If you use the print command from the console.....
print (murders)
Blog comments